Using the Power BI Desktop
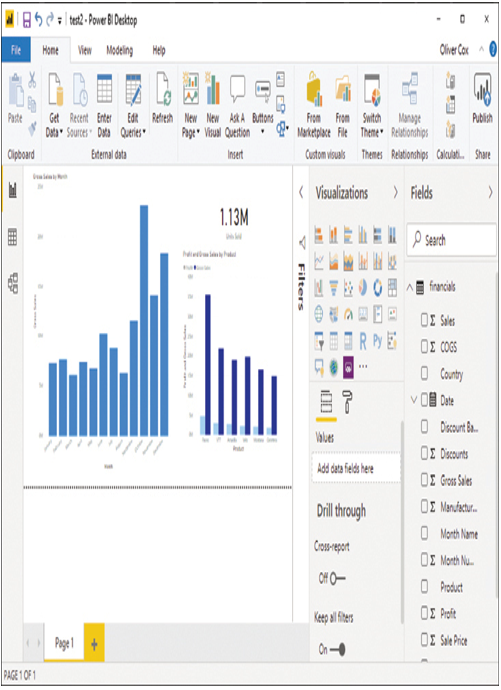
Power BI Desktop is a free Windows application that designers use to create Power BI content, which will be published on the Power BI Service for consumers to use. With an interface similar to that of a Microsoft Office application, as shown in Figure 1-11, the application allows designers to create and publish data visualizations by completing tasks such as the following:

FIGURE 1-11 The Power BI Desktop interface
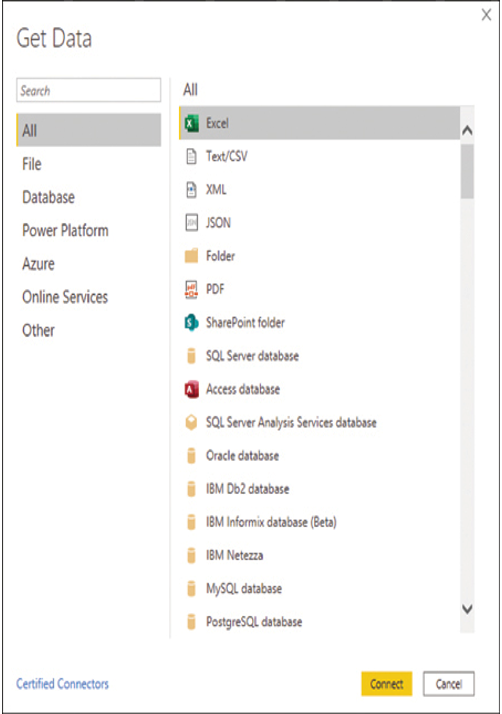
■ Connect to data—Power BI Desktop provides access to more than 200 data sources, as shown in Figure 1-12, which allow designers to obtain data from the local computer; network services, such as SQL databases; and cloud-based services, such as SharePoint and Google Analytics.

FIGURE 1-12 The Get Data dialog box in Power BI Desktop
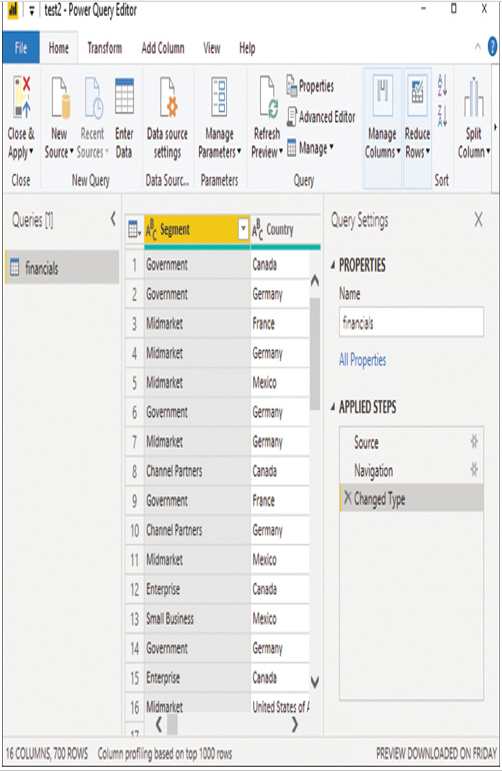
■ Transform and clean data—Power BI Desktop allows designers to model their data by combining sources, removing unneeded columns, and changing data types, using the Power Query Editor shown in Figure 1-13.

FIGURE 1-13 The Power Query Editor in Power BI Desktop
■ Create a report—With Power BI Desktop, designers can create reports with multiple pages or single-page dashboards.
■ Add visuals—Dragging fields onto the report canvas creates visualizations using an appropriate format for the data type. Designers can then modify the visualization by changing the type and configuring its properties.
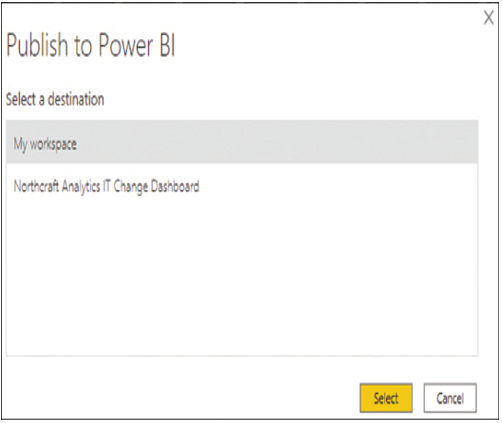
■ Publish report to the Power BI service—After the report is completed, designers can publish it to their Power BI services by selecting a specific location using the Publish to Power BI dialog box, as shown in Figure 1-14.

FIGURE 1-14 The Publish to Power BI dialog box in Power BI Desktop
Need More Review? Power BI Introduction
For more information on the basics of Power BI, see https://docs.microsoft.com/en-us/learn/modules/introduction-power-bi.
